
Predictable Client Growth Strategy for B2B Leaders
Predictable Client Growth Strategy for B2B Leaders
TL;DR:
- Most organizations fail to build predictable growth because they rely on guesswork instead of systematic pipeline management. Implementing segment-specific coverage targets, improving pipeline hygiene, and leveraging AI-driven insights enable consistent revenue attainment. A disciplined operating rhythm of forecasting, renewal management, and targeted execution ensures sustainable client growth and higher forecast accuracy.
Most B2B service leaders invest heavily in marketing and sales, then watch their revenue swing unpredictably from quarter to quarter. A predictable client growth strategy is not about working harder. It’s about replacing guesswork with a system that tells you what will close, when it will close, and what you need to add to hit your number. The difference between teams that hit quota consistently and those that scramble every month is rarely talent. It’s whether they have the right framework underneath them.
Table of Contents
- Key takeaways
- Building a predictable client growth strategy from the ground up
- Calculating pipeline coverage for your specific segments
- Tactical execution for pipeline velocity
- Sustaining growth through forecasting and renewals
- My honest take on why most growth plans fail
- How Lickfold can build your client pipeline for you
- FAQ
Key takeaways
| Point | Details |
|---|---|
| Ditch the generic 3x rule | Calculate coverage from your actual win rate plus a 20-30% buffer to reflect real deal slippage in your pipeline. |
| Segment your coverage targets | Enterprise, mid-market, and SMB deals require different coverage multiples. One number for all three creates blind spots. |
| Use LVR as a growth signal | A healthy Lead Velocity Rate of 15-25% month-over-month gives you a reliable forward-looking indicator before revenue hits. |
| Automate renewal detection early | Structured playbooks triggered 90-120 days before renewal cut churn and improve revenue predictability significantly. |
| Pipeline hygiene is not optional | Stale and single-threaded deals inflate your coverage numbers and destroy forecast accuracy. Clean your pipeline regularly. |
Building a predictable client growth strategy from the ground up
Before you touch tactics or tools, you need to audit what you are actually working with. Most organizations underestimate how much their pipeline data misrepresents reality. Win rates, average sales cycle lengths, and stage conversion rates vary dramatically by rep, territory, and customer segment. If your planning uses blended averages, you are building on sand.
Start with three data categories: historical win rates broken out by segment and rep tenure, average days in each pipeline stage, and close date accuracy over the last four quarters. If your reps are routinely pushing deals by 30 or 60 days, that is not a relationship problem. It is a forecasting calibration problem that needs to be measured and factored into your coverage math.
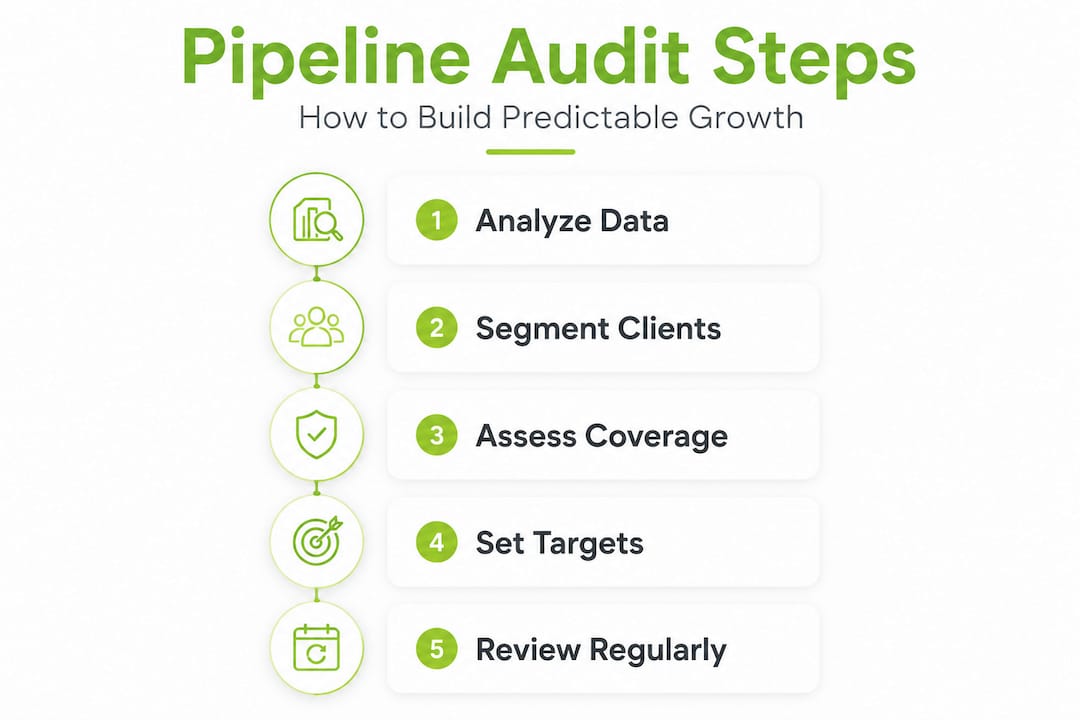
Segmentation is where most business growth plans break down. A company selling to Fortune 500 enterprises and also closing SMB contracts cannot manage both motions with the same pipeline rules. Enterprise cycles are longer, involve more stakeholders, and require more touches before moving. SMB deals close faster but churn faster too. You need separate targets, separate review cadences, and separate coverage goals for each.
The table below outlines the four prerequisites every B2B service organization needs in place before executing any scalable client strategy:
| Prerequisite | What to assess | Why it matters |
|---|---|---|
| Data quality | Win rates, cycle length, close date accuracy | Garbage data produces unreliable forecasts |
| Team structure | Rep tenure, territory load, ramp status | New reps need higher coverage buffers |
| GTM alignment | ICP definition, quota-to-capacity ratio | Misaligned quotas create structural underperformance |
| Tech stack | CRM hygiene, pipeline visibility, alerts | Manual tracking introduces lag and blind spots |
Pro Tip: Set dynamic coverage goals per rep based on their historical win rate and ramp status rather than applying a single company-wide target. A rep in month three of a new territory needs a very different pipeline than your top performer.
Integrated GTM planning that connects quota design, territory allocation, and performance tracking builds pipelines that naturally meet targets rather than ones that need constant manual correction.
Calculating pipeline coverage for your specific segments
The 3x pipeline coverage rule is one of the most repeated and least examined benchmarks in B2B sales. The logic sounds simple: keep three times your quota in the pipeline and you will hit your number. The problem is that this rule assumes a 33% win rate across every deal, every segment, and every rep. That is rarely true.
The right formula is straightforward. Take 1 divided by your actual win rate, then add a 20-30% buffer to account for deal slippage. If your win rate is 25%, your coverage target is 4x to 5x, not 3x. If your enterprise team closes 1 in 5 qualified deals, they need five times quota in their pipeline just to break even before accounting for deals that age out or stall.
Coverage needs vary significantly by segment. Here is a practical reference:
| Segment | Recommended coverage multiple | Primary reason |
|---|---|---|
| Enterprise | 4.4x or higher | Long cycles, multi-stakeholder, high slippage |
| Mid-market | 3.5x to 4x | Moderate cycle length, moderate churn risk |
| SMB | 2.8x to 3.5x | Shorter cycles, but higher volume required |
| New territory | 5x+ | No historical win rate to rely on yet |
| PLG motion | 2.4x | High conversion from product usage signals |
These numbers align with findings that enterprise requires 4.4x+ while product-led growth motions can operate leaner at 2.4x. The median across B2B companies sits at 3.2x, with top-quartile performers carrying 4.8x and companies below 2.5x showing distress signals.
Beyond the raw multiple, shift your attention to weighted pipeline. When you multiply deal value by stage probability and filter out deals older than 1.5 times your average sales cycle, weighted coverage predicts quota attainment far better than any raw number. A pipeline full of 18-month-old deals looks healthy on paper and is worthless in practice.
Pro Tip: Run a pipeline age audit every two weeks. Any deal sitting in the same stage longer than your median stage duration gets either a next step confirmed within 48 hours or moved to a dormant bucket. This single habit improves forecast accuracy faster than any new tool.
Tactical execution for pipeline velocity
Having the right coverage target means nothing if your pipeline is moving too slowly. Pipeline velocity, the rate at which opportunities progress and convert, is what turns a good coverage number into actual revenue.

One of the most effective consistent growth tactics is running focused 6-week sprint cycles against specific bottlenecks in your pipeline. Rather than trying to fix everything at once, identify the single stage where deals stall most often and run a concentrated play against it for six weeks. Six-week sprints targeting bottlenecks can improve pipeline velocity by 15-25% with visible impact inside 30 days. That is a meaningful shift that shows up in your forecast before the quarter ends.
Here is how to structure your tactical execution:
- Identify your velocity killer. Pull stage-by-stage conversion rates for the last two quarters. The stage with the largest drop-off is your sprint target.
- Launch a lead revival campaign. Prospects who went dark after an initial conversation are often your highest-converting quick wins. A personalized three-touch sequence referencing their original context outperforms new cold outreach on cost and response rate.
- Build multi-touch nurture sequences. A single email does not move anyone. Combine email, LinkedIn, and phone touches over 10-14 days for mid-funnel prospects who have not advanced. Lickfold’s AI-driven prospecting approach shows how personalized multi-touch campaigns outperform generic template blasts at every stage of the funnel.
- Monitor your Lead Velocity Rate weekly. A healthy LVR benchmark sits at 15-25% month-over-month growth in qualified leads. If your LVR is flat or declining, your pipeline will contract before your current deals close, which creates the quarterly scramble most leaders are trying to avoid.
- Cut stale deals ruthlessly. Stale and single-threaded deals inflate coverage numbers and create false confidence. The discipline to remove a deal from active pipeline and route it to a re-engagement track takes confidence, but it makes your forecast significantly more reliable.
- Integrate AI-driven alerts for deal risk. Modern CRM tools and AI platforms flag deals that have had no activity, no stakeholder engagement, or close dates that keep slipping. Acting on those signals in real time instead of at quarter-end changes your outcomes.
Strong follow-up sequence design is one of the highest-leverage client acquisition techniques available, especially for service businesses where relationships drive decisions.
Pro Tip: Focusing on ICP-fit conversion improvements strengthens your pipeline more than increasing raw lead volume. Twenty well-qualified prospects outperform one hundred weak ones, every time.
Sustaining growth through forecasting and renewals
Winning new clients is only half of a predictable revenue model. The other half is keeping the clients you have and forecasting renewals with enough lead time to act before it is too late.
Pipeline coverage is your best leading indicator for what revenue will look like 60-90 days out. The key is to use it as a signal to trigger decisions now, not to explain what happened last quarter. When coverage drops below your segment-specific threshold, you have roughly 60-90 days to correct it before the revenue shortfall becomes unavoidable.
Renewal management follows a similar logic. Most teams treat renewals reactively, which means they surface problems at 30 days out when options are limited. Renewal risk is detectable six months before expiration with structured playbooks in place, even though it typically surfaces at 90 days. The difference between a healthy renewal rate and a damaging one often comes down to whether you built a system to see it coming.
Here is what a sustainable renewal process looks like in practice:
- 120-day trigger: Automated health score review flags any account below threshold. Customer success receives an alert and confirms the account’s sponsor is still engaged.
- 90-day trigger: A formal renewal conversation is initiated. Any at-risk accounts are escalated to leadership with a documented mitigation plan.
- 60-day trigger: Pricing and contract terms are confirmed. Any expansion or upsell conversations are either activated or formally closed.
- 30-day trigger: Final confirmation and internal hand-off to billing. No surprises.
Automated renewal forecasting lifts accuracy from 67% to 89%, giving teams more than 60 days of advance warning to act on at-risk accounts. That kind of visibility does not happen by accident. It requires dashboards, escalation chains, and leadership visibility into account health scores across the entire book of business.
Treating renewals as a sales motion, with the same rigor as new logo acquisition, is what separates companies with 90%+ net revenue retention from those stuck at 75%.
Measurable client success also feeds back into your acquisition motion. When you document client outcomes systematically, those results become the case studies and proof points that shorten sales cycles for new prospects. Sustainable scale in client growth depends on this loop: deliver, measure, document, and use that evidence to win the next client faster.
My honest take on why most growth plans fail
I’ve reviewed a lot of pipeline reviews, forecasts, and GTM plans over the years, and the pattern is almost always the same. The number on the slide looks fine. The coverage is technically adequate. But underneath, the pipeline is full of deals that haven’t moved in 45 days, reps who optimistically pushed close dates instead of disqualifying, and a coverage target that was set to match quota, not to reflect actual win rates.
What I’ve found is that the organizations that break this pattern share one trait. They treat pipeline management as a revenue operations discipline, not a sales manager habit. They connect quota design, territory planning, and coverage targets into a single system where each variable informs the others. When a new rep joins, coverage goals adjust. When a segment’s win rate drops, the multiple adjusts. Nothing is static.
The uncomfortable truth is that structured forecasting processes improve sales performance by 15% on average, but most companies still run forecasts on gut feel and heroic last-week pushes. The fix is not complicated. It’s consistent. Build the system, feed it accurate data, and review it on a weekly cadence. That is what a real predictable client growth strategy looks like in practice, not a methodology on a slide, but a living operating rhythm that the whole revenue team owns.
How Lickfold can build your client pipeline for you
If the framework above describes where you want to be, but your current pipeline is still running on manual prospecting and inconsistent outreach, Lickfold can close that gap fast. Lickfold’s AI-driven system identifies decision-makers inside your ideal customer profile, runs personalized multi-touch outreach campaigns, and delivers human-qualified opportunities directly to your sales team, without the overhead of building a full outbound function in-house.
The system handles infrastructure, warm-up, reputation management, and follow-up sequences continuously. You get a data-driven growth approach without adding headcount. If you want to see what a filled pipeline looks like on your schedule, start the conversation with the Lickfold team today.
FAQ
What is a predictable client growth strategy?
A predictable client growth strategy is a systematic approach to pipeline management and client acquisition that uses historical data, segment-specific coverage targets, and structured execution to produce consistent, forecastable revenue rather than relying on sporadic deal flow.
Why is the 3x pipeline coverage rule often wrong?
The 3x rule assumes a 33% win rate across all deals, which rarely matches reality. The accurate formula divides 1 by your actual win rate and adds a 20-30% buffer for deal slippage, meaning a 25% win rate requires 4x to 5x coverage, not 3x.
How do you measure Lead Velocity Rate?
Lead Velocity Rate measures the month-over-month percentage growth in qualified leads entering your pipeline. A healthy LVR runs at 15-25% growth monthly and serves as a forward-looking indicator of future revenue before deals actually close.
When should renewal conversations start?
Renewal risk is detectable up to six months before expiration, but most teams wait until 30 days out. Automated triggers starting at 120 days, with escalation at 90, 60, and 30 days, give teams the lead time needed to retain at-risk clients and protect revenue.
How does pipeline hygiene affect forecast accuracy?
Stale deals and single-threaded opportunities inflate raw pipeline numbers without adding real revenue potential. Removing or reclassifying deals older than 1.5 times your average sales cycle produces a more accurate weighted pipeline and significantly improves forecast reliability.