
3 Attributes That Fix Firmographic Targeting for B2B Teams
3 Attributes That Fix Firmographic Targeting for B2B Teams
Firmographic targeting is the practice of segmenting and prioritizing accounts by company-level traits, industry, headcount, revenue, location, ownership, and growth signals, so sales and marketing spend goes toward companies that actually match your ideal customer profile. The payoff is efficiency: tighter lists, faster qualification, and higher close rates because reps stop chasing accounts that were never going to buy. Teams use it to build ABM target lists, filter paid audiences, and sequence SDR outreach around companies that look like their best existing customers.
TL;DR:
- Setting firmographic filters too loosely can lead to large, unmanageable lists while overly tight filters risk missing high-potential accounts.
- Using four to six digit NAICS codes and specific revenue or headcount thresholds can improve list quality and alignment with past successful deals.
- Combining firmographic criteria with technographic and intent signals helps prioritize accounts actively researching solutions and most likely to convert.
- Regularly refreshing data every 30 to 90 days and validating list accuracy prevents drift and ensures targeting remains relevant.
- Automated AI-driven workflows can streamline list building, decision-maker mapping, and multi-touch outreach, reducing manual effort and increasing precision.
Table of Contents
- What Firmographic Targeting Actually Filters On
- Where Firmographic Targeting Pays Off
- How To Build an ICP From Firmographic Data, Step By Step
- Where To Get Firmographic Data and How To Check It’s Any Good
- Layering Firmographics With Technographic and Intent Signals
- Where Firmographic Targeting Goes Wrong
- What To Measure To Prove It’s Working
- How Lickfold Digital Puts This Into Practice
- What I’d Tell a Team Starting From Zero
- A Faster Path to Firmographic-Qualified Pipeline
- Sources
What Firmographic Targeting Actually Filters On
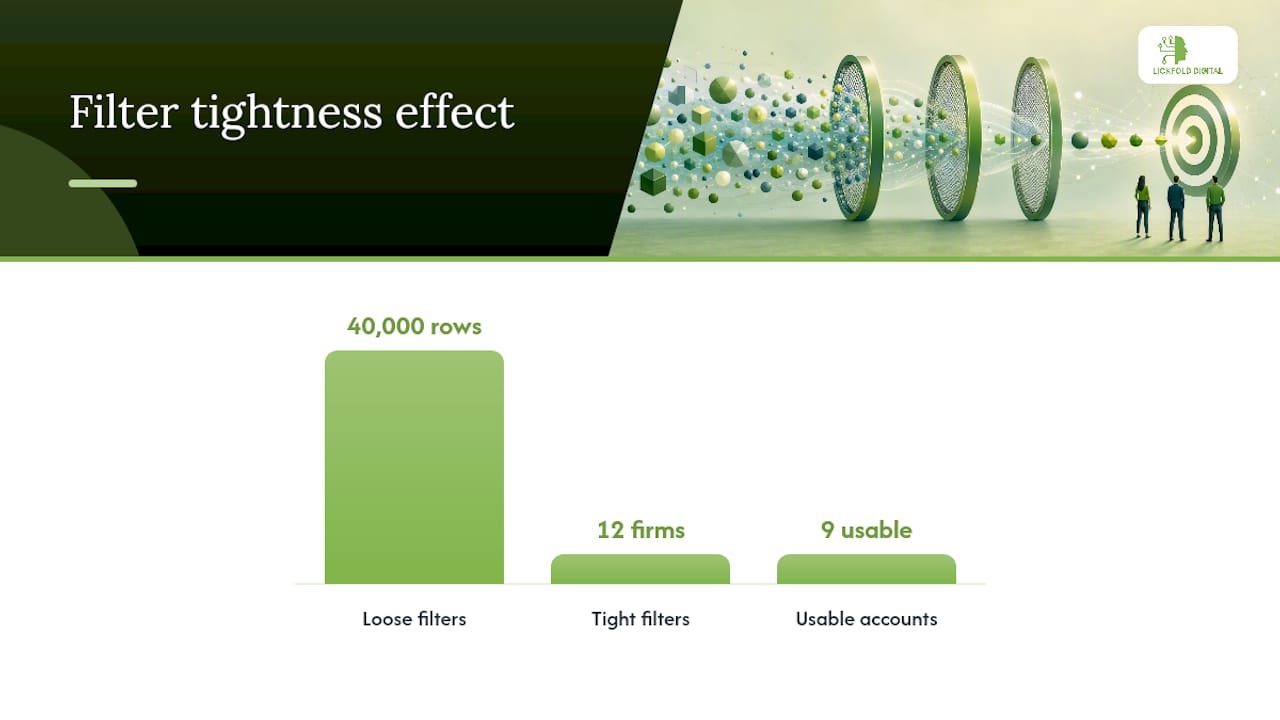
Firmographic targeting isn’t one variable. It’s a stack of company attributes, and how tightly you set each one determines whether your list is usable or worthless. Set the filters too loose and you get a spreadsheet with 40,000 rows nobody will ever call. Set them too tight and you get 12 companies, three of which already churned.
Industry is usually the first cut. Most teams use NAICS or SIC codes, but granularity matters more than people assume. Filtering on “541511 Custom Computer Programming Services” gets you a workable cluster. Filtering on the broader “Professional, Scientific, and Technical Services” sector gets you every law firm, ad agency, and engineering shop in the country. Firmographic data generally works best at the four to six digit NAICS level, specific enough to signal fit, broad enough to leave room for lookalikes.
Company size splits into headcount and revenue, and they don’t always agree. A 40-person law firm can bill more than a 400-person manufacturer. Pick the metric that actually predicted your past wins, and use bands instead of vague labels:
- Micro: 1 to 10 employees
- Small: 11 to 50 employees
- Mid-market: 51 to 500 employees
- Enterprise: 500-plus employees
Revenue and funding stage act as budget proxies when headcount data is thin, which happens constantly with private companies. A Series B company with $8 million raised behaves differently than a bootstrapped firm with the same headcount. Funding stage tells you whether a prospect has discretionary budget or is watching every dollar.
Location covers more than a mailing address. HQ location matters for compliance and buying norms, but operating footprint (where the company actually has offices or field teams) and time zone alignment matter more for outreach timing and territory assignment.
Ownership type changes the procurement process entirely. A public company runs purchases through committees and compliance reviews. A private equity-backed portfolio company often has centralized buying decisions coming from the PE firm, not the operating business. Family-owned businesses move slower but skip layers of approval once a decision-maker is bought in.
Growth signals round out the picture: recent hiring sprees, a new funding round, leadership changes, office expansions. These are momentum indicators, and they tend to correlate with buying windows because growing companies have new problems and fresh budget.
Technographic indicators, what software stack a company already runs, deserve a mention here even though they get their own layer later. Knowing a prospect uses a specific CRM, e-commerce platform, or cloud provider tells you what gaps might exist in their stack, and it’s often the fastest way to disqualify a poor fit before a rep ever picks up the phone.
Where Firmographic Targeting Pays Off
The efficiency case for firmographic targeting is straightforward: when you stop spreading effort across companies that will never convert, every dollar and every rep hour works harder. Teams that filter tightly on the attributes tied to past wins consistently report faster qualification cycles because reps aren’t spending calls figuring out whether a prospect is even a fit, they already know going in.
Four use cases show up again and again in B2B go-to-market motions:
- One-to-one ABM. A named-account list of 10 to 100 high-value targets, built from tight firmographic filters plus manual research, where each account gets custom messaging and a dedicated outreach plan.
- One-to-few programs. Clusters of 100 to 1,000 accounts sharing firmographic traits, like all Series A fintech companies in a specific headcount band, targeted with semi-personalized sequences.
- One-to-many programmatic targeting. Lists in the 1,000 to 10,000 range used to power paid media and LinkedIn matched audiences, where firmographic filters replace guesswork in ad platform targeting settings.
- SDR sequencing. Outbound cadences that route leads into different messaging tracks based on company size or industry, so a 20-person startup and a 2,000-person enterprise never get the same email.
Channel activation follows the same logic. LinkedIn Campaign Manager lets you upload firmographic criteria directly into audience builders. Paid media platforms use firmographic data to suppress obviously wrong-fit impressions before they ever get served. Email sequencing tools branch messaging based on the same attributes pulled into your CRM. The filter set doesn’t change, it just gets applied differently depending on where the account sits in your funnel.
How To Build an ICP From Firmographic Data, Step By Step
Most teams skip straight to buying a data list without first figuring out what “good fit” even means for their business. That’s backward. The right sequence starts inside your own CRM, not in a vendor’s database.
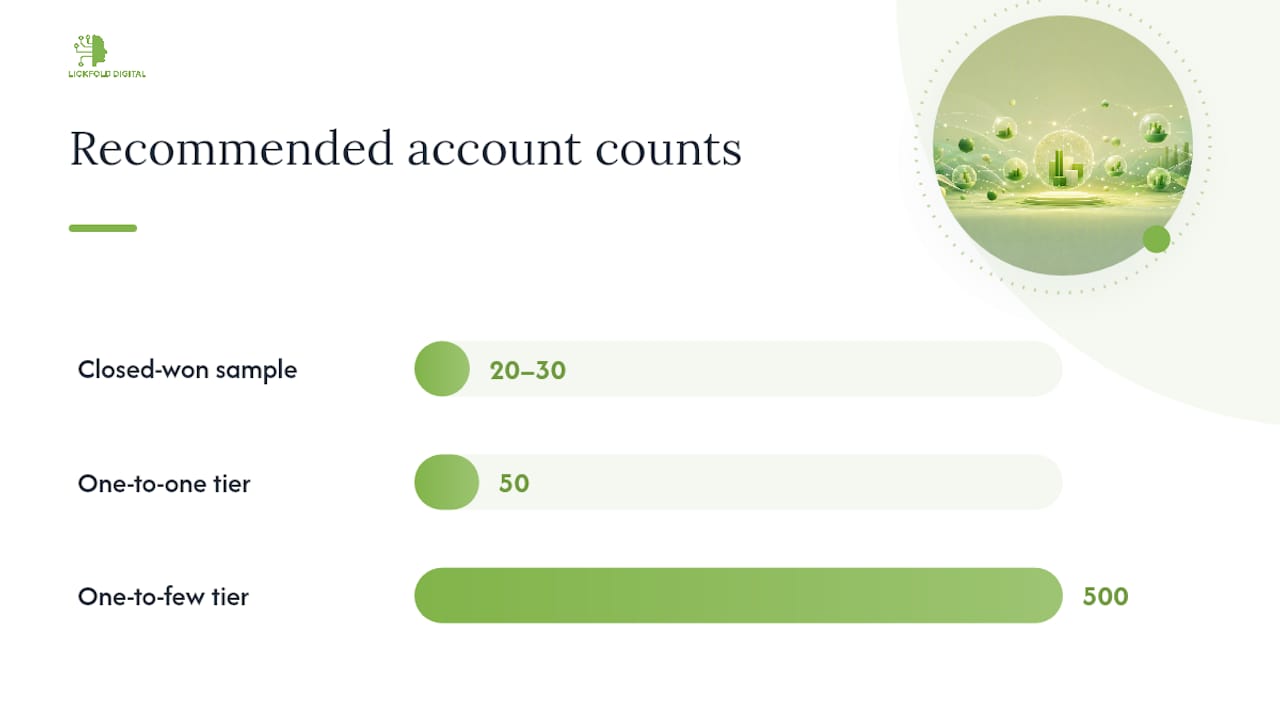
- Pull your top 20 to 30 closed-won accounts from the last 12 to 18 months. Export every firmographic field you have on them: industry code, headcount, revenue, funding stage, location, and time-to-close.
- Identify the 3 to 5 attributes that repeat most often. This is the analytical step most guides skip. Guides recommend analyzing closed-won accounts directly rather than guessing at an ICP from intuition, because intuition is usually wrong about which attribute actually drove the sale.
- Convert those attributes into numeric thresholds. Don’t write “mid-market SaaS companies.” Write “51 to 500 employees, $5M to $50M revenue, NAICS 5112, headquartered in North America.” Vague bands get you sloppy exports and reps arguing about whether a prospect qualifies.
- Build the filters in your CRM or ABM platform and export a seed list. Most CRMs support custom field filtering; ABM platforms like Demandbase or 6sense let you layer these thresholds directly into list-building workflows.
- Tier the resulting list by motion. Your top 50 accounts by revenue and strategic fit go into one-to-one ABM. The next 500 go into one-to-few clusters. Everything else feeds one-to-many programmatic and paid targeting.
- Check your total addressable market size against rep capacity before locking the list. A list of 40 accounts split across six reps means seven leads per rep, which is a staffing problem, not a targeting problem. A list of 50,000 accounts with two SDRs means you’ll never touch most of them, so narrow the filters instead.
- Set a refresh cadence. Firmographic data decays. Companies get acquired, downsize, relocate, or raise funding rounds that change their budget profile. A quarterly refresh works for stable industries; monthly refreshes make more sense in fast-moving sectors like software or biotech, where headcount and funding status shift constantly.
Pro Tip: Build your thresholds as a saved filter set inside your CRM, not a one-time export. When you refresh the data next quarter, you rerun the same filter instead of reconstructing your logic from memory, and you catch drift in your ICP before it costs you a quarter of wasted outreach.
The tiering step matters more than people give it credit for. A common mistake is putting 500 accounts into a one-to-one ABM motion because leadership wants “personalized outreach at scale.” That phrase doesn’t mean anything operationally. One-to-one demands custom research and messaging per account, which caps most reps at somewhere between 10 and 100 accounts depending on deal complexity. Beyond that, you’re running one-to-few whether you call it that or not.
Where To Get Firmographic Data and How To Check It’s Any Good
You don’t need an expensive vendor contract to start. Public tools cover a surprising amount of ground for initial market sizing and cluster building, and they’re free.
Census Business Builder lets you search by NAICS code, build custom geographic regions, and layer up to five variables into a bivariate map. It exports to CSV, Excel, or PDF, which means you can pull a regional list of businesses by industry and size band and drop it straight into a CRM for enrichment. It’s a strong starting point for one-to-many programs where you’re sizing a market before committing budget to a paid data provider.
ArcGIS Business Analyst goes further on the spatial side. It combines demographic, business, and spending data with mapping analytics, which makes it useful for trade-area analysis and site-selection style questions, where does your best customer profile physically cluster, and does that overlap with an expansion market you’re evaluating.
Commercial vendors earn their price tag on two things public tools don’t reliably deliver: coverage of private-company financials and freshness. A government dataset might update annually; a commercial provider tracking funding rounds and hiring signals updates far more often, which matters if your ICP includes growth-stage signals like recent Series B raises. Our guide to B2B market data platforms breaks down where the tradeoffs land between free and paid sources.
Whatever the source, run the same quality checks before trusting a list:
- Confirm NAICS codes are present, not blank, for every record. Missing industry codes usually mean the record is stale or incomplete.
- Check that revenue fields aren’t suppressed. Government sources like Census data suppress figures where disclosure rules apply, which can silently shrink your usable list.
- Look for a recent-activity flag, a job posting, a funding event, a leadership change, within the last 90 days.
- Deduplicate by domain or parent company before importing, not after. Duplicate records inflate your list size and waste rep time on accounts already in a sequence.
Even well-maintained commercial datasets carry a margin of error on fields like headcount, which tend to be self-reported or modeled rather than verified in real time. Build that expectation into your process instead of treating every field as ground truth.
Layering Firmographics With Technographic and Intent Signals
Firmographic filters answer one question: could this company buy from us? They don’t answer whether this company is actively looking right now. That’s what the next two layers are for.
The three-layer model works like this:
- Fit (firmographic): defines the universe of companies that match your ICP on paper.
- Interest (technographic): flags companies using tools that suggest a gap or a complementary need, layering technographic signals on top of fit narrows the list to accounts where the tech stack actually supports a sale.
- Intent (behavioral): surfaces companies actively researching a solution category right now, through content consumption, review-site activity, or search behavior.
Prioritization follows naturally from the stack. Accounts that hit all three layers, right fit, right stack, active research, go straight to high-touch SDR outreach or even direct executive engagement. Accounts that are fit-only, no intent signal yet, make more sense for programmatic paid campaigns and nurture sequences that keep the brand visible until intent shows up. Running full SDR sequences against a fit-only list burns rep hours on companies that aren’t ready, while relying on intent data alone without a firmographic filter first means chasing in-market signals from companies that were never going to be a fit anyway.
Where Firmographic Targeting Goes Wrong
The two most common failure modes sit at opposite ends of the same dial. Over-narrow filtering shows up as a target list under 50 accounts for a one-to-many motion, reps run out of prospects within weeks. Over-broad filtering looks like a list where half the accounts don’t share any real trait with your best customers, conversion rates crater and nobody can explain why.
- Stale data compounds both problems. A recommended refresh cadence runs 30 to 90 days depending on how fast your market moves, software and biotech skew toward monthly, industrial and manufacturing can often stretch to quarterly.
- Set a minimum TAM threshold before finalizing any list, and revisit your thresholds every quarter based on what’s actually converting, not what felt right at launch.
- Run a privacy check on any list before activation. Firmographic data describes companies, not individuals, but the moment you attach named contacts and personal email addresses, standard outreach compliance rules apply.
Pro Tip: If your list keeps shrinking every time you tighten a filter, you’re probably optimizing for a segment too small to support the motion you’ve chosen. Widen one variable, usually geography or revenue band, before you give up on the segment entirely.
What To Measure To Prove It’s Working
Firmographic targeting is only as good as what you can show for it. Four numbers tell you whether the segmentation is actually improving outcomes: conversion rate by segment, pipeline velocity (time from first touch to close), average contract value, and cost per opportunity generated.
- Track match rate and enrichment hit rate as process metrics, how much of your raw list actually resolved to usable, complete firmographic records.
- Watch data completeness by field; a list with 60% missing revenue data will skew every downstream analysis.
- Run a holdout test: hold back a control segment that doesn’t get the firmographic-filtered treatment and compare conversion against your targeted segment over a full sales cycle.
- Report these numbers monthly at minimum, weekly if you’re running active experiments on threshold changes.
How Lickfold Digital Puts This Into Practice
AI agents can run this workflow at scale: mapping decision-makers inside firmographically qualified accounts, then assembling multi-touch outreach sequences tailored to each company’s profile rather than a generic template. The system handles the deliverability side too, including warm-up email accounts and ongoing reputation management, to maintain sender reputation.
Every reply can get human qualification before it reaches a sales team to filter out leads that are not real. The same discipline applies to any team running this manually: verify records daily against fresh signals, and never let an SDR sequence run against a list that hasn’t been checked for accuracy in the last quarter.
What I’d Tell a Team Starting From Zero
Most teams overbuild their firmographic model before they’ve tested a simple version. Start with three attributes pulled from your closed-won accounts, not ten. Add richer data (funding stage, technographics, intent) only once the basic filter is producing measurably better conversion than your old spray-and-pray list.
The signal to escalate is budget and team size: once you’ve got more than a couple of reps running full-time outbound, or a paid media budget large enough that wasted impressions actually cost real money, the investment in better data and layering pays for itself fast.
Do this next: pull your last 20 closed-won deals, find the three attributes they share, and build one filtered list before you buy anything.
— Duarte
A Faster Path to Firmographic-Qualified Pipeline
Building and maintaining firmographic segments by hand works, until your list needs weekly refreshes, your reps run out of qualified accounts mid-quarter, or your data starts drifting stale without anyone noticing. AI agents can run that entire loop automatically: identifying companies matching ICP thresholds, mapping decision-makers inside them, and launching personalized multi-touch sequences without manual data refresh cycles.
The decision between doing this in-house and handing it to a managed system usually comes down to capacity. If you’ve got someone dedicated to data hygiene, list-building, and sequence management every week, DIY works fine. If those tasks keep sliding because your team is busy closing deals instead of maintaining spreadsheets, that’s the signal to hand it off. Every reply that comes back through the system can be qualified by a person before it reaches the sales team, helping ensure that leads in the pipeline are real opportunities rather than unrelated firmographic lookalikes. Visit the Lickfold Digital platform to see how the setup maps to your current ICP, or book a free session to walk through your closed-won data together.
Sources
Start with Census Business Builder for free market sizing and ArcGIS Business Analyst for spatial trade-area work. For the analytical framework behind ICP-building and layered targeting, see ZoomInfo’s firmographic data guide and Metadata’s B2B audience targeting explainer. For lead-generation strategy that pairs with this targeting work, Baby Love Growth’s guide is worth a read.
- Census Business Builder overview & instructions (CBB)
- ArcGIS Business Analyst overview — Esri
- Firmographic Data: The Complete B2B Targeting Guide — ZoomInfo / Pipeline
- What Is B2B Audience Targeting? | Metadata