
How to Reduce Acquisition Costs: A 2026 Playbook
How to Reduce Acquisition Costs: A 2026 Playbook
The fastest way to reduce acquisition costs is to measure CAC by channel, prioritize high-conversion segments, and run small, data-driven experiments that shift spend toward the highest cost-per-outcome channels. Cutting budget across the board rarely works. Funnel optimization and targeting high-converting segments lowers effective acquisition cost more reliably than any blanket reduction.
CAC formula: Total acquisition spend (marketing + sales + onboarding) ÷ new customers acquired in the period.
A worked example: a certain level of combined marketing and sales spend resulted in a number of new customers closed. CAC = total spend divided by number of customers.
The 3:1 CLV:CAC benchmark is the standard orientation point. Below 3:1, you are likely overpaying to acquire customers relative to the value they return. Above 5:1, you may be underinvesting in growth.
Immediate next steps (do these in the next 72 hours):
- Pull channel-level CAC for the last 90 days. If you cannot do this today, fixing attribution is your first project.
- Identify your single highest-converting audience segment and check whether it receives proportional budget.
- Pick one landing page with meaningful traffic and queue an A/B test on the headline or primary CTA.
- Audit your referral program. If you do not have one, sketch the reward structure this week.
- Reallocate at least 10–15% of spend from your worst-performing channel to your best-performing one.
Top three quick levers to try first: audience trimming on paid channels, a landing-page headline test, and a referral incentive push to your existing customer base.
Key Takeaways
Reducing acquisition costs is a measurement and prioritization problem first, a spending problem second. The teams that lower CAC fastest are the ones that fix attribution before cutting budgets, run structured experiments, and treat retention as an acquisition lever.
| Point | Details |
|---|---|
| CAC formula | Total acquisition spend (marketing + sales + onboarding) ÷ new customers in the period. |
| CLV:CAC benchmark | A 3:1 ratio is the widely cited floor for healthy acquisition economics. |
| Fastest quick wins | Audience trimming, a single landing-page A/B test, and a referral push deliver measurable results in 1–8 weeks. |
| Retention reduces CAC | Small improvements in retention increase CLV, making your current CAC look efficient without changing spend. |
| Measurement-first sequence | Fix attribution, audit channel CAC, reallocate to winners — in that order — before launching new tactics. |
| Lickfold for B2B outbound | Lickfold’s AI-driven prospecting playbook documented a 65% reduction in lead-generation cost by automating research, warm-up, and qualification. |
Table of Contents
- What is CAC and how do you calculate it correctly?
- High-impact tactics you can implement in 0–90 days
- How to run CRO experiments that actually move the needle
- How retention and referrals reduce CAC more than spending cuts
- How to make paid channels buy more customers for the same spend
- Medium-term content and SEO levers that lower acquisition cost
- Which tools and integrations actually reduce CAC?
- Lickfold Digital’s AI-driven outbound playbook: a real cost-reduction example
- How to measure impact and prioritize CAC experiments
- Common mistakes that increase CAC and how to fix them
- Why sales and marketing alignment directly lowers acquisition cost
- How customer feedback and market research sharpen your CAC reduction strategy
- The part most playbooks get wrong
- Lickfold Digital cuts B2B lead costs without the agency overhead
- Sources
What is CAC and how do you calculate it correctly?
Customer acquisition cost (CAC) is the total spend required to bring one new paying customer through the door. The formula sounds simple, but most teams calculate it wrong by leaving out sales salaries, onboarding costs, or tool subscriptions that directly support acquisition.
Full CAC formula:
CAC = (Total marketing spend + Total sales spend + Onboarding costs directly tied to conversion) ÷ New customers acquired in the period
For a B2B SaaS company spending $80,000 on marketing, $60,000 on sales compensation, and $10,000 on onboarding tools in a quarter that closed 50 customers: CAC = ($80,000 + $60,000 + $10,000) ÷ 50 = $3,000 per customer.
Key linked metrics every revenue leader must track
- CLV:CAC ratio: Customer lifetime value divided by CAC. The 3:1 benchmark is widely cited as the floor for healthy unit economics. At 2:1, you are burning margin. At 6:1, you are probably leaving growth on the table.
- Payback period: How many months of gross margin it takes to recover CAC. For B2B SaaS, 12–18 months is typical; under 12 months is strong.
- Channel-level CAC: Blended CAC hides the story. Segment by paid search, paid social, organic, outbound, and referral. The spread between your best and worst channel is usually where the biggest savings live.
- Conversion rate at each funnel stage: Visitor to lead, lead to MQL, MQL to SQL, SQL to close. A 10% improvement at the lead-to-MQL stage can reduce blended CAC materially without touching ad spend.
CAC segmentation rules
Calculate CAC separately by cohort: product line, acquisition channel, campaign, and customer tier (SMB vs. enterprise). A single blended number masks which segments are profitable and which are destroying margin. Most teams that run this exercise for the first time discover one channel or segment carrying the rest.
| Metric | What it measures | Why it matters |
|---|---|---|
| Blended CAC | Total spend ÷ all new customers | Baseline health check |
| Channel CAC | Spend per channel ÷ customers from that channel | Identifies over/under-investment |
| CLV:CAC ratio | Customer lifetime value ÷ CAC | Signals sustainable unit economics |
| Payback period | CAC ÷ monthly gross margin per customer | Cash flow and growth capacity |
| Funnel conversion rate | % moving between each stage | Pinpoints where spend is wasted |
High-impact tactics you can implement in 0–90 days
Speed matters here. The measurement-first audit — fix attribution, identify underperforming spend, then reallocate — is the highest-leverage sequence. Everything below flows from that foundation.
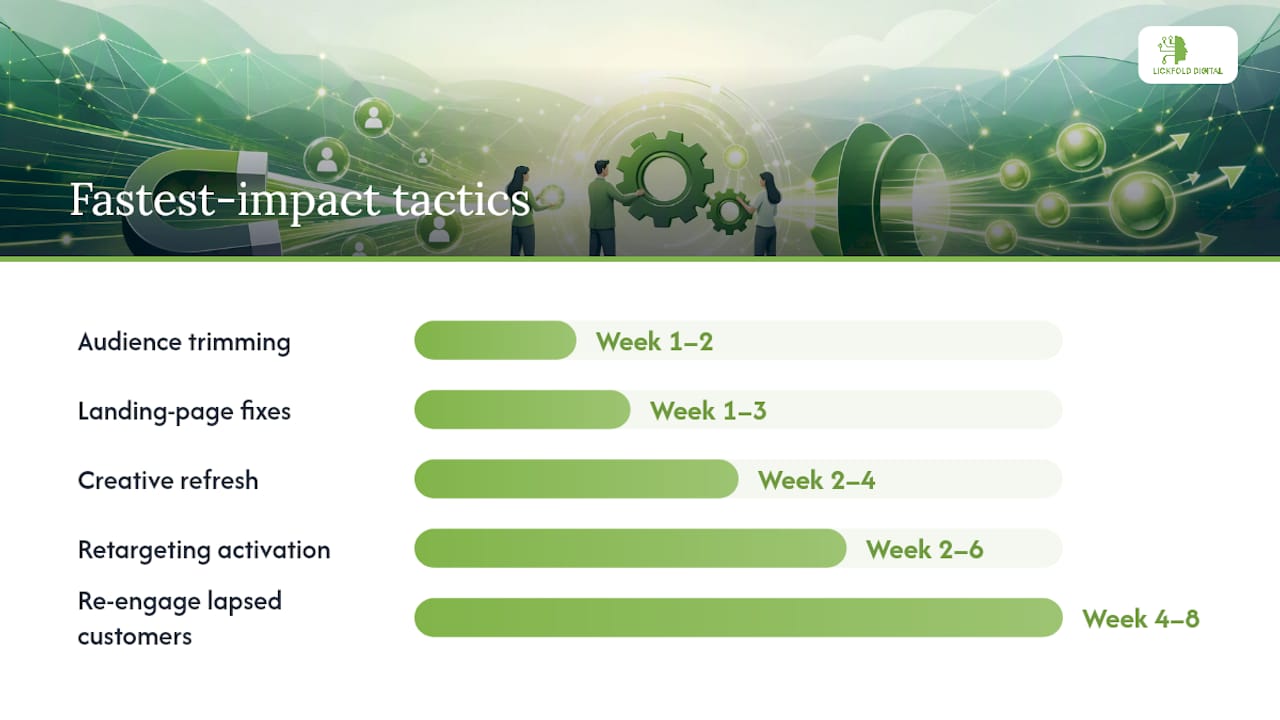
Audience trimming (Week 1–2, owned by paid media manager)
- Pull audience performance data from Google Ads and paid social. Identify age brackets, geographies, or device types with CAC more than 40% above your target.
- Exclude or reduce bids on those segments immediately.
- Redirect that budget to your top two performing audience clusters.
Expected impact: a reduction in CAC on paid channels within a short timeframe.
Creative refresh and A/B test (Week 2–4, owned by creative + paid team)
- Identify your top-spending ad creative. If it has run more than 60 days, it is likely fatigued.
- Write two new variants: one that leads with a specific outcome (a number, a result), one that leads with a pain point.
- Run both against the control with equal budget. Set a minimum of 100 conversions per variant before calling a winner.
Retargeting activation (Week 2–6, owned by paid media)
Retargeting audiences convert at significantly higher rates than cold traffic because they already know you. Segment by page visited (pricing page visitors vs. blog readers) and serve different messages. Pricing page visitors get a direct offer or demo CTA; blog readers get a lead magnet.
Landing-page quick fixes (Week 1–3, owned by CRO or growth)
- Remove navigation links from paid landing pages. Every exit point is a leak.
- Cut the form to three fields maximum for top-of-funnel offers.
- Add one specific social proof element above the fold (a named customer result, not a generic star rating).
Re-engaging lapsed customers (Week 4–8, owned by CRM or lifecycle)
Lapsed customers already know your product. Segment by recency and reason for churn if you have that data.
Referral incentive push (Week 2–8, owned by customer success or marketing)
If you have a referral program, email your top 20% of customers with a specific, time-bounded incentive. If you do not have one, a simple “give $X, get $X” structure launched in a single email to your best customers can generate referred leads within days. Referred customers also tend to have lower churn, which improves CLV:CAC over time.
Success criteria: Set a target CAC reduction percentage for each tactic before you start. If you hit it, scale. If you do not, check attribution before concluding the tactic failed.
How to run CRO experiments that actually move the needle
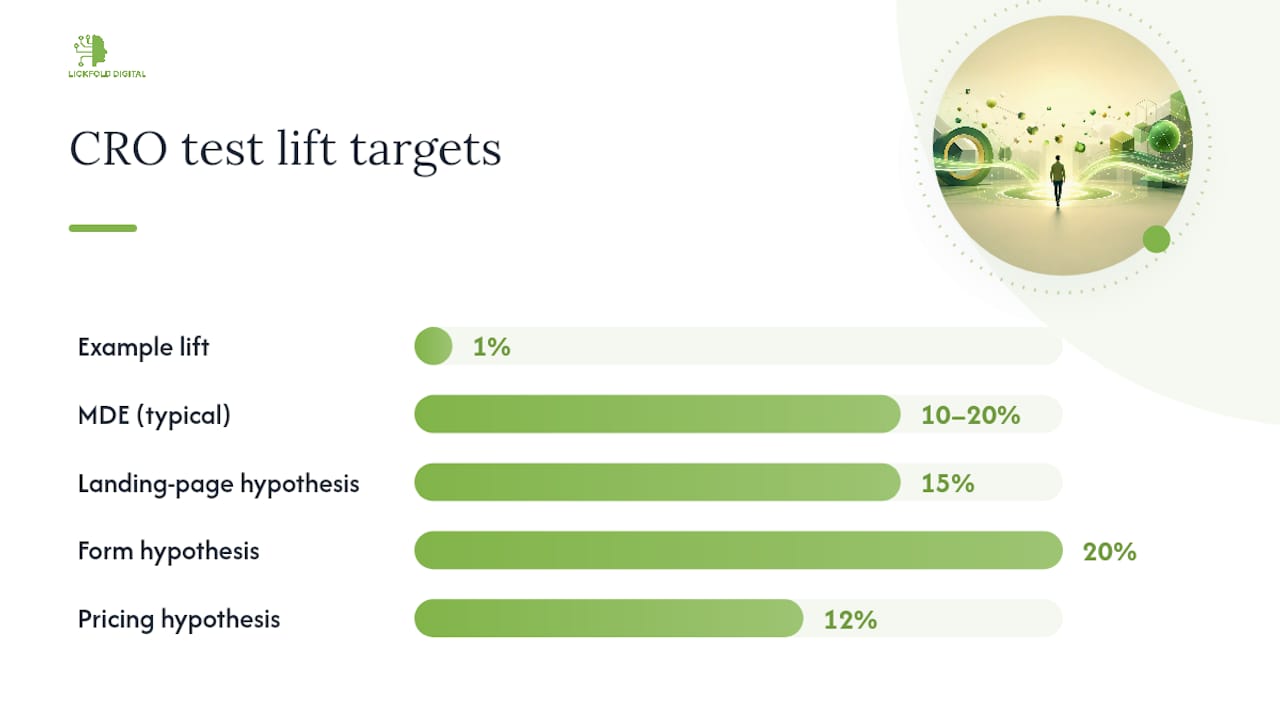
Conversion rate optimization is where most teams leave the most money. A 1% improvement in landing-page conversion rate on a page receiving 5,000 monthly visitors can generate dozens of additional leads with zero additional spend.
Test design checklist:
- Hypothesis: “Changing [element] from [A] to [B] will increase [metric] by [X%] because [reason].”
- Primary metric: One metric only. Conversion rate, form completion rate, or click-through rate. Never test against multiple metrics simultaneously.
- Minimum detectable effect: Decide the smallest improvement worth detecting (usually 10–20% relative lift) before you start. This determines your required sample size.
- Traffic threshold: For most landing pages, you need at least 200–300 conversions per variant to reach statistical significance. Low-traffic pages need longer test windows, not shorter ones.
- Test duration: Run for at least two full business cycles (typically two weeks minimum) to account for day-of-week variation. Stopping early because one variant looks good is one of the most common and costly mistakes.
Sample test hypotheses worth running:
- Landing page: “Replacing the generic hero headline with a specific outcome statement (‘Close 3x more demos in 60 days’) will increase form submissions by 15%.”
- Form: “Reducing the contact form from seven fields to three will increase completion rate by 20%.”
- Pricing page: “Adding a ‘most popular’ badge to the mid-tier plan will increase mid-tier selections by 12%.”
Running tests with Google Analytics and Google Ads:
Use Google Analytics 4’s built-in experimentation features or connect a dedicated testing tool. For paid traffic, create separate ad groups or campaigns pointing to each variant so you can track conversion data cleanly. Avoid mixing organic and paid traffic in the same test — the intent profiles differ enough to contaminate results.
Pro Tip: Never run a test during a major promotional period, product launch, or holiday window. Seasonality and novelty effects will make your results uninterpretable. If you must test during a high-traffic period, document it and treat the results as directional only.
Statistical significance at 95% confidence is the standard threshold, but for lower-stakes tests on high-traffic pages, 90% is defensible if you need to move faster.
How retention and referrals reduce CAC more than spending cuts
That improvement alone shifts your CLV:CAC ratio meaningfully, making your current CAC suddenly look efficient.
Content, retention, personalization, and conversion optimization are repeatable levers that reduce blended CAC over medium to long horizons. Retention is the one most teams underinvest in because its CAC impact is indirect.
Referral program blueprint:
- Define eligibility: customers who have been active for at least 90 days and have completed onboarding.
- Set the reward structure: a two-sided incentive (both referrer and referee receive value) consistently outperforms one-sided offers.
- Track referral source in your CRM from day one. Without attribution, you cannot measure the program’s CAC impact.
- Set a 60-day review cadence. If referral volume is low, the problem is usually awareness, not the reward.
Onboarding improvements that compound:
- Map the steps between signup and first value moment. Every unnecessary step is a churn risk.
- Assign a human touchpoint (a call or a check-in email) within the first 72 hours for high-value accounts.
- Build a short onboarding email sequence (3–5 emails over 14 days) that drives users to the one action most correlated with retention.
Re-engagement playbook:
- Segment lapsed customers by time since last activity: 30–60 days, 60–90 days, 90+ days.
- For 30–60 day lapsed: a single “we noticed you haven’t logged in” email with a specific use-case prompt.
- For 60–90 day lapsed: a direct offer (a free session, a feature unlock, a discount on renewal).
- For 90+ days: a win-back sequence of two to three emails, then move to a suppression list.
Expected timeline to see re-engagement impact on blended CAC: 4–12 weeks depending on list size and offer strength.
How to make paid channels buy more customers for the same spend
Paid media CAC is the most visible and the most frequently mismanaged. The problem is rarely the channel. It is usually the audience, the creative, or the attribution model.
Channel-level action list:
- Audience exclusion: Exclude existing customers, recent converters, and low-intent segments (bounced visitors under 10 seconds) from prospecting campaigns.
- Lookalike refinement: Build lookalikes from your highest-CLV customers, not just your most recent converters. The two groups are often different.
- Bid pacing: Review bid strategies quarterly. Target CPA bidding underperforms on low-volume campaigns; manual or enhanced CPC often outperforms it below 30 conversions per month.
- Server-side tracking: Browser-based tracking often misses a significant share of conversion events due to ad blockers and privacy changes. Server-side tracking recovers that signal and improves attribution accuracy, which directly improves automated bidding performance.
Ad test rig:
Run one variable at a time. Test audience first (same creative, different audiences), then creative (same audience, different ads), then landing page (same ad, different destinations). Mixing variables in a single test makes it impossible to know what moved the needle.
Reporting metrics to track weekly:
- Channel CPA (cost per acquisition, not just cost per click)
- ROAS (return on ad spend) by campaign and ad set
- Conversion rate at each funnel step (click to landing page, landing page to lead, lead to close)
- Assisted conversions: channels that appear in the path but not as the last touch
Qualitative channel comparison:
| Channel type | Expected CAC impact | Effort to implement | Time to impact | Best for |
|---|---|---|---|---|
| Paid search (intent-based) | High | Low–medium | 1–4 weeks | B2B and B2C, mid-market |
| Paid social (awareness) | Medium | Medium | 4–8 weeks | B2C, brand-building |
| Outbound email (AI-driven) | High | Medium | 2–6 weeks | B2B, enterprise |
| Organic/SEO | Medium–high | High | 3–12 months | B2B and B2C, long-term |
| Referral programs | High | Low | 4–12 weeks | B2B, high-CLV products |
| Retargeting | High | Low | 1–3 weeks | All segments |
Medium-term content and SEO levers that lower acquisition cost
Content and SEO do not produce leads next week. Over 3–12 months, they build a compounding organic channel where high-intent content mapped to buyer queries drives qualified traffic at near-zero marginal cost per visitor.
Content priority list:
- Bottom-of-funnel pages first: Comparison pages, “best [category] for [use case]” pages, and pricing-adjacent content convert at the highest rates because the visitor is already close to a decision.
- Objection-handling content: Pages that address the top three reasons prospects do not buy. These often rank for long-tail queries and convert well because they meet the reader at a specific concern.
- Topical cluster build-out: Pick two or three core topics and build 8–12 supporting articles around each. Topical authority in a cluster tends to lift rankings across all articles in it.
Sample topic-to-conversion flow:
A visitor searches “how to automate B2B outbound prospecting” and lands on a detailed guide. The guide includes a lead magnet (a checklist or a template). The visitor downloads it, enters your CRM, and receives a nurture sequence. Within 30 days, a percentage books a demo. The organic CAC for that customer is the content production cost divided by the number of customers that flow eventually converts.
Timeline and metrics to watch:
- Months 1–3: keyword rankings begin moving; organic sessions increase.
- Months 3–6: content landing pages start generating leads; track conversion rate on those pages separately.
- Months 6–12: compounding effect becomes visible in blended CAC as organic share of new customers grows.
Combining content with paid amplification: Promote your highest-converting content pieces with a small paid budget ($500–$2,000 per month) to accelerate audience building and retargeting pool growth. This lowers blended CAC faster than waiting for organic traffic alone.
Which tools and integrations actually reduce CAC?
The right tool reduces cost-per-outcome. The wrong one adds overhead without moving a metric. Evaluating total cost of ownership rather than sticker price is the discipline most teams skip, and it is why so many tech stacks grow without producing proportional results.
Tool-role matrix:
| Tool category | Problem it solves | Integration priority |
|---|---|---|
| CRM (e.g., HubSpot) | Tracks leads, deals, and customer data; enables segmentation and lifecycle automation | High — connects to all other tools |
| Attribution platform | Assigns credit accurately across channels; prevents cutting channels that drive assisted conversions | High — feeds budget decisions |
| Server-side tracking | Recovers lost conversion signals from ad blockers and privacy changes | High — improves paid bidding |
| Experimentation platform | Runs A/B tests with statistical rigor; prevents false positives | Medium |
| Content automation | Produces SEO content at scale; reduces per-article cost | Medium |
| AI prospecting (e.g., Lickfold) | Automates outbound research, warm-up, and qualification; reduces cost per qualified lead | High for B2B outbound |
Integration notes:
- CRM to ad platforms (Google Ads, Meta): sync customer lists for exclusion and lookalike audiences. This single integration often reduces wasted spend by 10–20%.
- CRM to personalization tools: use firmographic and behavioral data to serve different content to different segments, improving conversion rates without additional traffic.
- Attribution to budget reallocation: set a weekly review trigger. If a channel’s CAC rises more than 20% above target for two consecutive weeks, reallocate budget before the quarter ends.
Checklist for evaluating a new tool:
- Does it reduce cost-per-outcome, or does it just add a new dashboard?
- What is the implementation time, and who owns it?
- Does it integrate with your CRM and attribution stack without custom development?
- What is the total cost including setup, training, and ongoing management?
Procurement discipline — running structured competitive evaluations and measuring total acquisition cost for vendor investments — applies directly to martech buying. Teams that treat tool selection like a purchasing event rather than a convenience decision consistently get better pricing and better outcomes.
Lickfold Digital’s AI-driven outbound playbook: a real cost-reduction example
This case draws from Lickfold Digital’s internal documentation and is disclosed as such. The author is affiliated with Lickfold Digital.
Lead quality was inconsistent, and the cost per qualified lead was high because human time was the primary input.
Lickfold’s AI-driven playbook replaced the manual workflow in stages:
- Audience mapping: AI agents identified decision-makers within the ideal customer profile using firmographic filters (company size, industry, revenue range, technology stack).
- Warm-up infrastructure: Dedicated email accounts were set up and warmed over 3–4 weeks to establish sender reputation before any outreach began.
- Personalized multi-touch outreach: The system generated personalized messaging for each prospect based on company-specific signals, not generic templates. Sequences included email, LinkedIn touchpoints, and timed follow-ups.
- Human qualification: All replies were reviewed and qualified by a human before being passed to the sales team. This step prevented low-quality leads from consuming sales time.
- Reputation management: Ongoing monitoring of domain health and deliverability rates kept the outreach infrastructure performing.
The documented outcome from Lickfold Digital’s internal case material: a 65% reduction in lead-generation cost when AI prospecting automated the research, warm-up, and qualification steps that previously required full-time human effort. The sales team’s time shifted from prospecting to closing.
Replication checklist:
- Define your ideal customer profile with at least five firmographic filters before building any list.
- Allow 3–4 weeks for email warm-up before sending at volume. Skipping this step is the single most common cause of deliverability failure.
- Write message variants for at least three different pain points. Personalization at the company level outperforms generic industry-level messaging.
- Assign one human to qualify replies before any lead reaches a sales rep.
- Track cost per qualified lead weekly from day one. Without this metric, you cannot measure the playbook’s impact.
Required team roles: one campaign manager, one copywriter for initial sequences, one qualifier (can be part-time). Timeline to first qualified leads: typically 6–8 weeks from setup start. Primary risk point: deliverability failure from skipping warm-up or using shared sending infrastructure.
For a step-by-step technical walkthrough, the AI prospecting guide for B2B sales covers the full operational stack.
How to measure impact and prioritize CAC experiments
Most teams run too many experiments at once and measure too few of them correctly. A simple prioritization matrix and a weekly review cadence fix both problems.
Prioritization matrix (impact vs. effort):
| Tactic | Expected CAC impact | Implementation effort | Time to measurable impact |
|---|---|---|---|
| Audience exclusion (paid) | High | Low | 1–2 weeks |
| Landing-page A/B test | Medium–high | Low–medium | 2–4 weeks |
| Referral program launch | High | Medium | 4–8 weeks |
| Server-side tracking setup | High | High | 4–6 weeks |
| Content cluster build-out | Medium–high | High | 3–6 months |
| AI-driven outbound setup | High | Medium | 6–8 weeks |
Start with high-impact, low-effort tactics. Audience exclusion and a single landing-page test can be live within a week and produce measurable results within two to four weeks.
Dashboard metrics to track weekly:
- Blended CAC (total spend ÷ all new customers)
- Channel-level CAC for each active acquisition channel
- CLV:CAC ratio (updated monthly at minimum)
- Payback period
- Funnel conversion rates at each stage
- Cost per qualified lead for outbound channels
Experiment template (one page, reusable):
- Hypothesis: [specific change] will [improve metric] by [X%] because [reason]
- Primary metric: [one metric only]
- Owner: [name]
- Traffic requirement: [minimum conversions per variant]
- Start date / end date: [minimum two business cycles]
- Decision rule: call winner at 95% confidence; pause if no movement after full duration
Weekly optimization cadence: Every Monday, review the prior week’s channel CAC and conversion rates. This cadence, described in Cometly’s six-step framework, prevents runaway inefficient spend from compounding across a quarter.
Common mistakes that increase CAC and how to fix them
The most expensive mistakes:
- Over-optimizing for last-click attribution: Last-click gives all credit to the final touchpoint and starves upper-funnel channels that drive assisted conversions. Fix: switch to data-driven attribution in Google Analytics and review assisted conversion reports before cutting any channel.
- Cutting channels that drive assisted conversions: Paid social often appears expensive on a last-click basis but drives the awareness that makes search ads convert. Cut it and search CAC rises. Fix: run a 30-day holdout test before eliminating any channel.
- Ignoring customer quality: Optimizing for volume of leads rather than quality of customers drives CAC down on paper while destroying CLV:CAC. Fix: segment CAC by customer tier and optimize toward your highest-CLV cohort.
- Bad attribution from browser-based tracking only: iOS privacy changes and ad blockers mean browser-based tracking misses a significant share of conversions. Fix: implement server-side tracking and compare reported conversions to CRM-closed deals monthly.
- Hidden integration and one-off costs: M&A and integration costs are routinely underestimated; the same pattern applies to martech implementations. A tool that costs $500 per month but requires $20,000 in custom integration work has a very different total acquisition cost than its sticker price suggests.
Red-flag checklist for weekly reviews:
- CAC has risen more than 20% in two consecutive weeks with no corresponding increase in lead quality.
- Conversion rate at any funnel stage has dropped more than 15% week-over-week.
- Churn rate has increased, which inflates effective CAC by reducing CLV.
- A single channel now accounts for more than 60% of new customers (concentration risk).
- Referral volume has dropped to zero (program awareness or reward problem).
When to pause or sunset a tactic: If a tactic has run for its full planned duration, received adequate traffic, and produced no measurable improvement in the target metric, pause it. Do not extend the timeline hoping for a different result. Document what you learned and move to the next experiment.
Why sales and marketing alignment directly lowers acquisition cost
Misalignment between sales and marketing is one of the most reliable ways to inflate CAC without anyone noticing. Marketing generates leads that sales ignores; sales complains about lead quality; marketing optimizes for volume to hit MQL targets. The result is spend on leads that never close.
The fix is a shared definition of a qualified lead, agreed on by both teams, with a conversion rate target at each handoff stage. When sales knows which channels produce their fastest-closing deals, they can give marketing the feedback needed to prioritize those channels.
Practical alignment steps:
- Hold a monthly revenue review where marketing and sales review channel CAC, MQL-to-SQL conversion rates, and deal velocity together. Not in separate reports. Together.
- Define a service-level agreement: marketing commits to a volume and quality of MQLs; sales commits to a follow-up time (24 hours is the standard) and a feedback loop on lead quality.
- Use HubSpot or a comparable CRM to track the full journey from first touch to closed deal. Without this visibility, neither team can see where the handoff breaks down.
The AI sales tips for B2B teams that produce the lowest CAC are almost always the ones where sales and marketing have agreed on the ideal customer profile before any campaign launches.
How customer feedback and market research sharpen your CAC reduction strategy
Most CAC reduction programs focus entirely on the funnel mechanics and ignore the signal sitting in customer conversations. Customers who converted tell you exactly why they bought. Customers who churned tell you exactly where the product or the pitch failed. Both signals are free and most teams collect neither systematically.
Practical feedback integration:
- Run a win/loss interview program. Five to ten interviews per quarter with recently closed and recently lost deals will surface patterns that no analytics dashboard shows. Ask specifically: “What almost stopped you from buying?” That answer identifies the objection your landing pages and sales scripts should address.
- Survey customers at 30 and 90 days post-purchase. The 30-day survey catches onboarding friction; the 90-day survey catches early churn signals. Both feed directly into retention improvements that reduce blended CAC.
- Use NPS data to identify your promoters. These are your referral program candidates. A targeted outreach to NPS 9–10 customers asking for referrals or reviews consistently outperforms a broadcast referral email.
Market research that informs channel decisions:
- Run a quarterly review of where your best customers spend time online. This is not a survey; it is a conversation. Ask three to five of your highest-CLV customers which newsletters they read, which conferences they attend, and which LinkedIn communities they participate in. That information is worth more than most paid audience research.
- Track competitor messaging changes. When a competitor shifts their positioning, it often signals a market shift that affects which acquisition channels and messages will perform best over the next 6–12 months.
Integrating feedback into your CAC reduction strategy means your experiments are grounded in what customers actually care about, not what the team assumes they care about. That distinction closes the gap between tactics that look good in a planning deck and tactics that actually move the number.
The part most playbooks get wrong
The conventional framing of CAC reduction is almost always about spending less. Cut the underperforming channel. Reduce the agency retainer. Pause the campaign. That instinct is understandable, but it is usually wrong, and it is wrong in a specific way: it treats acquisition cost as a budget problem when it is almost always a measurement and conversion problem.
The teams I see make the most durable progress on CAC are not the ones that cut the hardest. They are the ones that fix attribution first, so they actually know what is working. Then they run small, structured experiments rather than large, intuition-driven pivots. Then they invest in retention because they understand that a customer who stays longer makes the acquisition cost look smaller in retrospect.
The AI-driven outbound case documented here is a good example of that logic applied to outbound. The cost reduction did not come from spending less on prospecting. It came from replacing low-leverage human time (manual research, generic outreach, unqualified follow-up) with a higher-leverage system that produced better-qualified leads at lower cost per outcome. The spend shifted; the total did not necessarily drop.
Treat it as directional evidence of what is achievable with a well-implemented AI outbound stack, not as a guaranteed outcome for every deployment. Your results will depend on your ICP definition, your warm-up discipline, and the quality of your qualification criteria.
The broader principle holds regardless of the specific tool or tactic: acquisition cost reduction is a compounding discipline. The teams that build the measurement infrastructure, run the experiments, and align sales and marketing around shared definitions of quality will outperform the teams that chase the next channel or cut the current budget. Every time.
Lickfold Digital cuts B2B lead costs without the agency overhead
If your paid channels are expensive, your outbound is manual, and your sales team spends more time prospecting than closing, the problem is not effort. It is leverage. Lickfold Digital’s AI-driven prospecting platform replaces the manual research, list-building, warm-up, and follow-up work that consumes your team’s time with an automated system that runs continuously and delivers qualified leads directly to your pipeline.
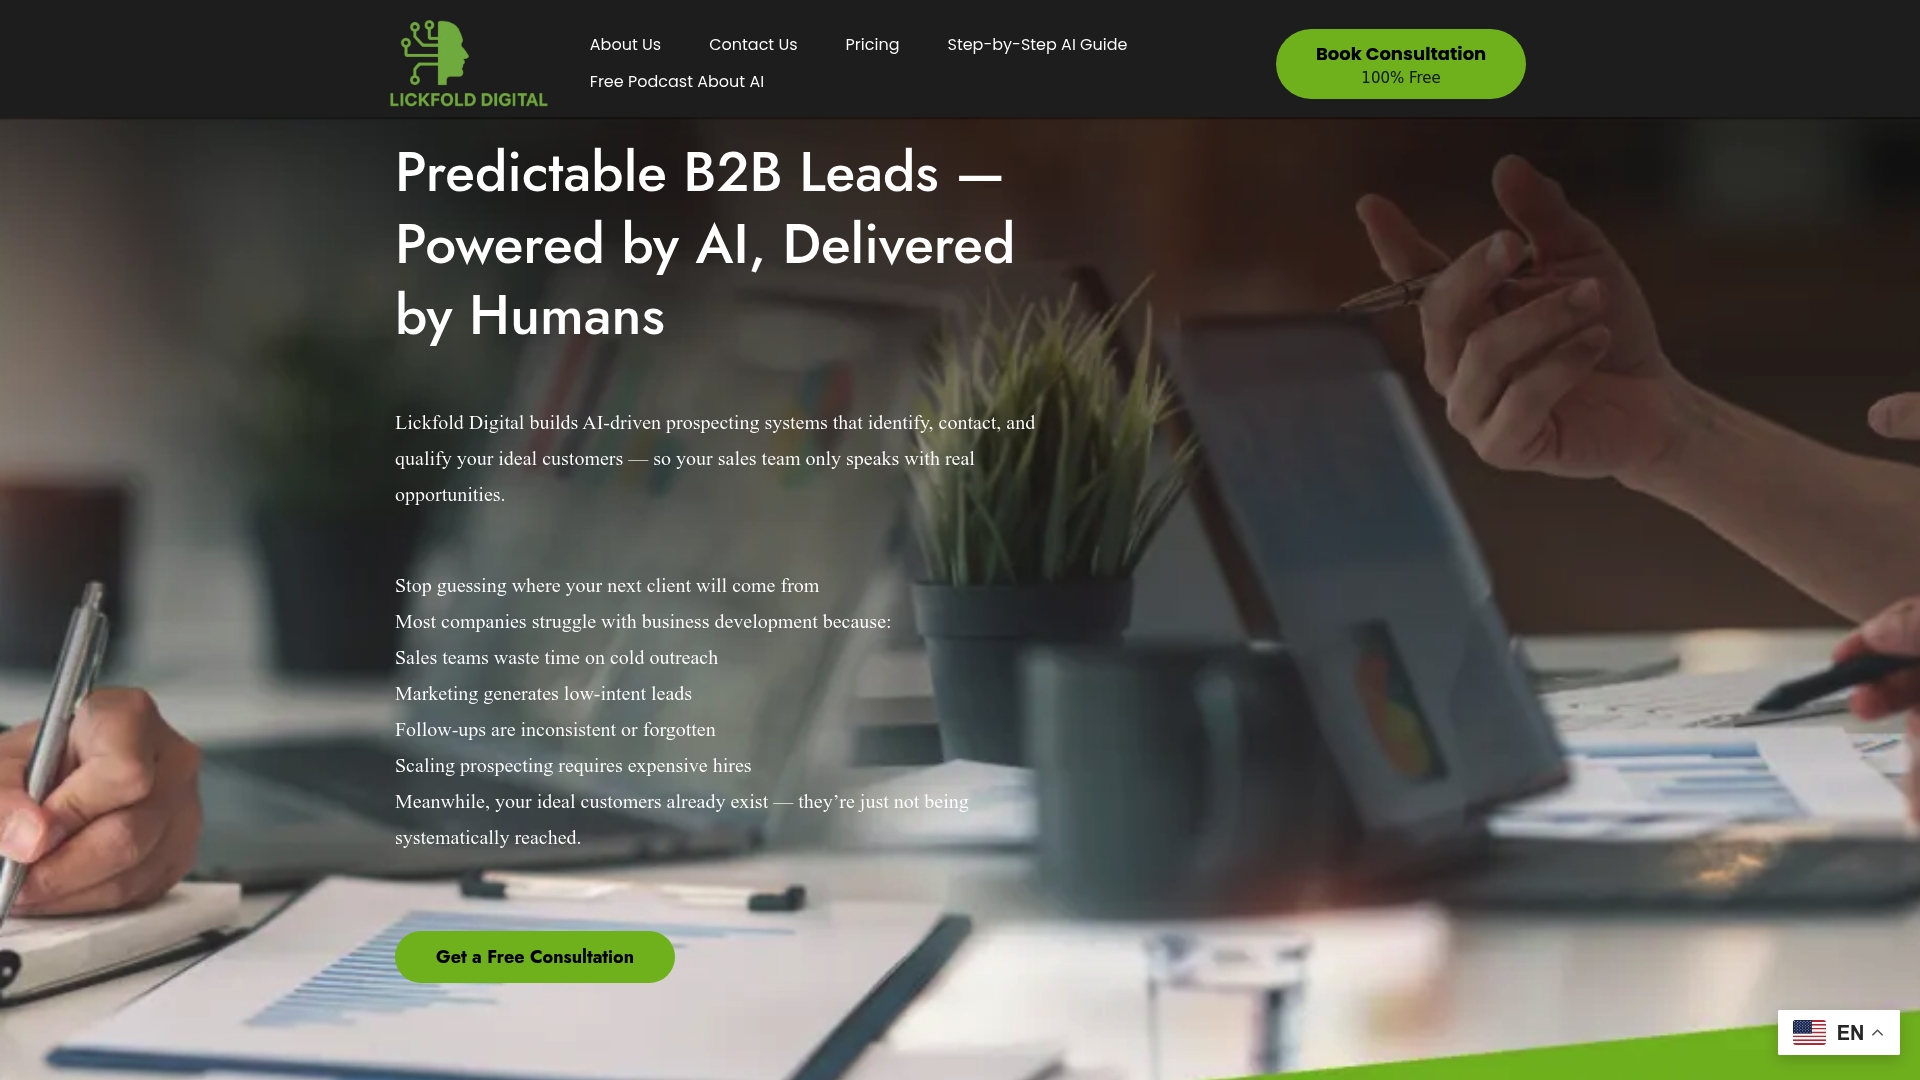
The platform is built for B2B service firms, agencies, and sales-driven organizations where the cost of a sales rep’s time is the real acquisition cost. AI agents map your ideal customer profile, identify decision-makers, build personalized outreach sequences, and qualify replies before any lead reaches your team. The result is a predictable pipeline without the overhead of a large outbound team or a long-term agency contract.
Schedule a call to see how the playbook applies to your market and customer profile, or visit Lickfold Digital to get started.
Sources
- How SaaS teams should think about CAC and growth (Stripe resources)
- Customer acquisition cost (Zendesk blog)
- How To Reduce Customer Acquisition Cost: 6 Key Steps (Cometly)